
Histogram is a graphic representation of the tonal range in a photograph, and it's analysis of the image's tonal range provides a precise check on the exposure. Does histogram really help photographers to understand their images? Yes, it helps photographers to understand the tonal color structure of the photographs. Histogram can show whether your photograph is composed of the dark tones, light tones or the mixed color tones. Histogram can be represented with 256 color tones in a digital format in which the darkest color tone is represented by the number 0 on the left side of the graph and the lightest color tone is represented by the number 255 on the right side of the histogram graph. On the tonal graph, the horizontal axis displays the color tones from the darkest on the left to the lightest on the right and the vertical axis shows the number of pixels that each color tone has. When you frame and compose the shot, your camera's light meter reads the scene before you take the photo and the histogram analyzes the photo you've just taken. You can choose to have a histogram graph appear on the camera's LCD along with the playback display of your photo by using the Multi-Selector Dial button.
Why histogram is so important in photography?
It is a very important graphic tool because it helps to understand the exposure of the photograph you have taken and tells you if it is necessary to adjust the exposure or not. It's not necessary to check the histogram graph for each and every photo you have taken but it's good practice to check the histogram when the scene's lighting condition is tricky. When there are areas of deep shadow and the bright light in the same scene and you're going to take a series of images in the same setting and want to be sure that the exposure is balanced, histogram graph might come handy.
What can anybody get from the histogram graph?
Histogram will tell you if the photographs or parts of the photographs are overexposed (lack of details in the highlights) or underexposed (loss of details in the shadows). When you look at the histogram graph and there is a heavy concentration on the left side of the graph, that means the image is underexposed and you've lost the details in the shadow areas. Likewise, a heavy concentration on the right side of the graph means the image is overexposed and your highlights may be blown out. When you see any one of these kinds of histogram graph, you can think of a solution to balance your exposure whether it is underexposed or overexposed. If your photograph is overexposed, you can increase the shutter speed, close down the aperture or lower the ISO to balance the exposure. And if your photograph is underexposed, you may want to decrease the shutter speed, wide open the aperture or increase the ISO sensitivity level little bit while considering the possible noise in the photograph.
Let's examine these couple of photographs below and analyze the histogram graph so that we can apply it to the practice.

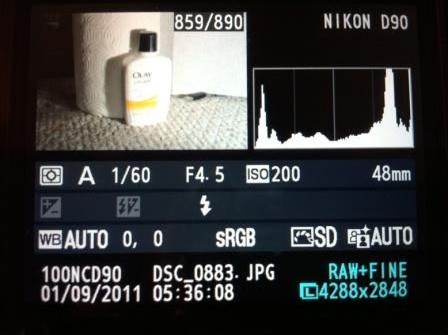
Underexposed Histogram
You can see fair amount of pixels are shifted on the left side of the graph because the photograph is composed with the dark color tones (shot at night) and it is little bit underexposed. You can see the large amount of pixels are in the middle of the distribution indicating that there are mid-tone colors. That's why it is a good idea to shoot in RAW+JPEG mode because sometimes, it is possible to retrieve those loss tones in RAW images but in JPEG mode, it's permanently lost.
Now let’s see an example of overexposed image and see how the histogram graph indicates the problem.
Overexposed Histogram
Here you can see a lot of spikes of pixels on the very right side of the graph indicating that this photograph is overexposed and the highlights are blown out destroying the details in the picture. It has quite a few pixels on the left side as well which tells us that the part of the image is underexposed as well.
You can also set the highlight overexposure warning (default in Nikon D60 I think but has to setup in D90) in your DSLR camera settings. When you set this option, the areas of overexposure will blink in the playback image and you will know exactly which areas of the image are overexposed. Several Nikon DSLR models feature secondary, color histograms, and if you choose to display them, you'll see three small graphs that show the intensity of the RGB (Red, Green and Blue) color values in the scene. If you need to adjust these values, you can do so by controlling the white balance setting in your camera. Some of the Nikon DSLR cameras also allow you to magnify specific area of the photograph during the playback so that you can check the exposure and detail rendering in very specific parts of the image. In effect, you are directing the histogram's area of analysis.
I encourage you to take some pictures and analyze them using the histogram graph and the more you use the graph, more you will be familiar with what histogram can tell you about the photographs.