
If you own DSLR or planning to buy one in near future, you will be looking for lenses sooner or later and when time comes, you have to be very careful while choosing lenses. There are limited types of camera bodies (which are upgraded pretty frequently) but there are wide varieties of lenses and stay longer in the market before it gets upgraded to newer version. Usually camera bodies get upgraded in couple years whereas lenses get upgraded in 5 to 6 years or even more in some cases. Having said that, investment on lenses is long term than bodies and hence you have to be more careful when choosing correct lenses. Choosing lens depends on what kind of work you do in photography. If you are doing sports photography, you may want to choose fast telephoto lenses; for macro photography, you need macro lens; for landscape photography, you may want to choose wide angle lenses and for portrait, you need medium range prime lenses. Now you may be wondering which particular lens to choose among so many varieties and how do we know which lens is good over the other. It is very important to know that you have to compare lenses within its own category. That means you have to compare wide angle lens from one brand to wide angle lens of another brand because every lens is made with different components and materials to serve different purpose. OK then, do we have a tool to compare lenses? And the short answer is yes, we do. There is something called an MTF chart which gives us graphical model of the lens performance and describes behavior of particular lens in different conditions. You may find this article bit technical but I will try to explain as simple as I can.
What is an MTF Chart?
MTF is an abbreviation for Modulation Transfer Function and is widely used standard measurement to evaluate the performance of the lens. In a generic language, Modulation means the process of modifying signal to result an output from given input. In ideal case, lens should transmit all the lights it receives as an input but no lens is ideal and can't transmit all the lights because glass is not 100% transparent. So with the help of an MTF chart, we see graphical representation of how much light one lens can modulate (transmit) to the sensor in different scenarios.
The quality of lens depends on its resolution and contrast which are closely related to each other. If the lens can transmit high contrast, it can have better resolution power. But lens resolution is also dependent to other factors and that is why an MTF charts are preferred method to study optical performance but not the only one measure to determine its quality. An MTF chart consists two axis; X-axis and Y-axis.
The X-axis (horizontal axis) shows the distance from the center of the image (based on film or 35mm equivalent censor) toward the edges. In the graph, "0" represents the center of the lens and the different numbers represent the distance from center towards the edge of the lens in mm (millimeter).
The Y-axis (vertical axis) represents what percentage of light the particular lens can transmit. It is represented in percentage with maximum value of 1 meaning 100% transmittance of light (which is ideal case only). So in real case scenario, higher the Y-axis value better the lens performance will be (lens having 0.9 Y-axis value is better than lens having 0.7).
How to read an MTF Chart?
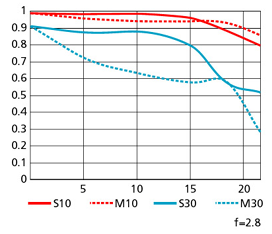
Below is an example of an MTF chart. It has two pairs of lines (two solid and two dotted) plotted in different number values. Those different lines and numbers indicate how well the lens performs with different measurements. When measuring the lenses performance for an MTF chart, the test is carried out with the lens working at its maximum aperture value. An MTF chart consists of measurement for the Sagittal (Solid line) and Meridional (Dotted line) lines at both 10 lines per millimeter and 30 lines per millimeter hence producing a chart with 4 separate lines. In this case, you can think of 10 lines or 30 lines sketched inside 1 mm size area and we are going to see how well any lens can transmit the contrast between each lines so that quality of image can be produced in the sensor; better the contrast, better picture quality will be.
MTF Chart for AF-S NIKKOR 14-24mm f/2.8G ED lens
Wide (14mm) Tele (24mm)
MTF Chart Wide Nikkor 14-24mm

MTF Chart Tele Nikkor 14-24mm
MTF chart for AF-S DX NIKKOR 35mm f/1.8G lens

MTF Chart NIKKOR 35mm
Here are the few key things you have to know to understand an MTF chart. The red line (10 lines per millimeter) indicates the lenses ability to reproduce low spatial frequency or low resolution. This line indicates the lenses contrast values and the higher and straighter this line is the better. The higher the line appears the greater the amount of contrast the lens can reproduce. Similarly, the blue line (30 lines per millimeter) indicates the lenses ability to reproduce higher spatial frequency or higher resolution. This line relates to the resolving power of the lens and again the higher the line the better.
As the line starts on the left of the chart this represents the center of the lens and as the line moves to the right it indicates the edge of the lens. So you can see how much the contrast and sharpness of the lens decreases from the center to the edge of the image.
Using an MTF chart to determine the Bokeh effect of the lens
Another factor that can be read from the MTF graph is the 'bokeh'. Bokeh is a term used to describe the quality of the out of focus areas a lens produces. The bokeh effect varies between lenses and the effect is influenced by the quality of the lens elements used and also the number of aperture blades in the lens design (more blades produce a better circle and therefore a better 'bokeh' effect). The closer the solid line and the dotted line are together, the better the 'out of focus' effect will be on a particular lens.
Nowadays all the major lens manufacturers include MTF Chart along with their lens specification.
Reference: Nikon Europe and Nikon USA